Table of contents
Open Table of contents
- Enterprise Observability Platform Analysis: Governance, Architecture, and Security — with an OpenObserve AI-Era Update
- Executive Summary
- 1. Platform Overview & Market Position
- 2. Governance Framework Analysis
- 3. Architecture & Technical Implementation
- 4. Security Architecture & Implementation
- 5. Operational Excellence & Performance
- 6. Implementation Roadmap & Recommendations
- 7. Conclusion & Strategic Recommendations
Enterprise Observability Platform Analysis: Governance, Architecture, and Security — with an OpenObserve AI-Era Update
A comparative analysis of Sentry, SigNoz, and New Relic, with a sourced OpenObserve AI/LLM observability update
Executive Summary
This report provides enterprise decision-makers with detailed insights into Sentry, SigNoz, and New Relic, covering governance frameworks, architecture, security, and operational deployment. The 2026 update adds a sourced OpenObserve assessment centered on its AI/LLM observability capabilities.
Scope of the OpenObserve update: OpenObserve is included in the executive summary and current capability tables below. The governance diagrams, benchmark figures, capacity estimates, weighted decision matrix, implementation examples, and scenario budgets later in this legacy article remain three-platform material. They are not an OpenObserve scorecard and should not be used to select OpenObserve without a separate, workload-specific evaluation.
Key Findings
- Sentry excels in error tracking and developer experience but requires additional tooling for comprehensive observability. Available as SaaS or self-hosted.
- SigNoz offers the most cost-effective open-source solution with strong unified observability capabilities. Available as both self-hosted (open source) and managed cloud service.
- OpenObserve is open-source, unified observability for the AI era: alongside logs, metrics, and traces, it makes LLM and agent behavior observable through OpenTelemetry. It is a strong option for teams that need to connect model quality, token cost, latency, and production telemetry; advanced identity and governance features require an enterprise license.
- New Relic provides the most comprehensive enterprise features but at premium pricing. SaaS-only deployment model.
Platform Deployment Options Summary
| Platform | SaaS Option | Self-Hosted Option | Open Source |
|---|---|---|---|
| Sentry | ✅ Yes | ✅ Yes | ✅ Yes |
| SigNoz | ✅ Yes | ✅ Yes | ✅ Yes |
| OpenObserve | ✅ Yes | ✅ Yes | ✅ Core (AGPL-3.0) |
| New Relic | ✅ Yes | ❌ No | ❌ No |
1. Platform Overview & Market Position
1.1 Sentry: Developer-Focused Error Monitoring
Core Strengths:
- Superior error tracking and debugging capabilities with intelligent error grouping
- Extensive SDK ecosystem (JavaScript, Python, Go, Java, .NET, Ruby, PHP, and more)
- Strong developer experience with source map support and breadcrumbs
- Advanced performance monitoring and profiling features
- Session replay for frontend debugging
- Release tracking and deploy notifications
Deployment Options:
- SaaS: Fully managed cloud platform with generous free tier
- Self-Hosted: Open-source version available for complete control
- Hybrid: Mix of SaaS and self-hosted components possible
Enterprise Considerations:
- Primarily focused on application monitoring (APM and error tracking)
- Limited infrastructure and log monitoring capabilities
- Requires integration with other tools for comprehensive observability
- Premium pricing for high-volume enterprise usage ($80-200K+ annually)
- Strong compliance support (SOC 2, GDPR, HIPAA BAA available)
1.2 SigNoz: Open-Source Unified Observability
Core Strengths:
- Complete unified observability platform (traces, metrics, logs) - “three pillars” in one
- OpenTelemetry-native architecture providing vendor-neutral instrumentation
- True full-stack observability: APM, infrastructure monitoring, and log management
- Powerful ClickHouse database for fast analytics and long-term retention
- Cost-effective with predictable pricing based on data ingested
- Modern UI with custom dashboards and query builder
Deployment Options:
- SigNoz Cloud (SaaS): Fully managed with automatic scaling ($25K-80K annually for enterprise)
- Self-Hosted (Open Source): Complete platform deployable on your infrastructure ($15K-50K annually in infrastructure costs)
- Hybrid: Possible to run collectors on-premise while using cloud backend
Enterprise Considerations:
- Younger ecosystem (founded 2021) compared to established players
- Requires internal expertise for self-hosted deployments and tuning
- Growing but smaller community support compared to Sentry/New Relic
- Excellent for cost-conscious enterprises needing full observability
- Self-hosted option provides complete data sovereignty and compliance flexibility
- Active development with frequent feature releases
1.3 OpenObserve: Open-Source, Unified Observability for the AI Era
Core Strengths:
- Unified logs, metrics, and traces with OTLP ingestion over HTTP and gRPC
- AI and LLM observability built on OpenTelemetry: LLM calls can be traced with model parameters, prompt/response content, token usage, cost, latency, and errors
- Agent and RAG workflow visibility through linked spans and session-level traces, including tool calls, retries, and handoffs
- Online evaluations for production traffic—such as relevance, hallucination, bias, and toxicity scoring—documented as an enterprise capability
- Columnar Parquet storage on object storage, with a SQL-style query experience and PromQL support for metrics
- Self-hosted and managed-cloud deployment options; the self-hosted distribution is available as a binary and Docker image
- Dashboards and query-driven alerts in the same platform
- Open-source core under AGPL-3.0, reducing dependence on a proprietary telemetry format
Deployment & Governance Considerations:
- Production high availability requires deliberate operation of the supporting services, object storage, and load balancing
- The open-source core is not the same as the enterprise feature set: fine-grained RBAC, SSO, and audit capabilities should be validated against the required license and edition before a compliance commitment
- OpenTelemetry keeps instrumentation portable, but operational data-model, retention, and access-control decisions still need to be designed for the chosen deployment
- Prompt and response capture requires an explicit data-handling decision: treat that content as sensitive telemetry and apply appropriate collection, retention, and access controls
- Evaluation provides visibility and scoring; it is not evidence of automatic, real-time guardrail enforcement
For current product capabilities, see OpenObserve’s AI observability overview, LLM application documentation, LLM and agent observability guide, OTLP ingestion documentation, and enterprise license terms.
1.4 New Relic: Enterprise Observability Leader
Core Strengths:
- Comprehensive full-stack observability with deepest feature set
- Advanced AI/ML-powered insights (Applied Intelligence, anomaly detection)
- Mature enterprise features: advanced alerting, incident management, SLO tracking
- Extensive third-party integrations (600+ integrations)
- Enterprise-grade compliance (SOC 2, FedRAMP Moderate, HIPAA, ISO 27001)
- Powerful querying with NRQL (New Relic Query Language)
- Distributed tracing, log management, infrastructure monitoring, RUM, synthetics
Deployment Options:
- SaaS Only: Fully managed cloud platform across multiple regions
- No Self-Hosted Option: Cloud-only deployment model
- Data residency: Multiple regions available (US, EU, etc.) for compliance
Enterprise Considerations:
- Premium pricing structure ($100K-500K+ annually for enterprise scale)
- Potential vendor lock-in concerns with proprietary agents and NRQL
- Complex feature matrix across different tiers (Standard, Pro, Enterprise)
- Most comprehensive feature set but requires significant investment
- Excellent for large enterprises needing maximum capabilities
- Strong support and professional services organization
1.5 Detailed Feature Comparison
| Feature Category | Sentry | SigNoz (Self-Hosted) | OpenObserve | New Relic |
|---|---|---|---|---|
| Unified Traces/Logs/Metrics | ⚡ Partial (limited logs) | ✅ Full | ✅ Full | ✅ Full |
| Deep APM | ✅ Excellent (errors focus) | ✅ Full | ✅ Full | ✅ Excellent (most mature) |
| AI/LLM Observability | ⚡ Integrations required | ⚡ Evaluate current fit | ✅ LLM/agent traces, cost, tokens, and evaluations | ✅ Mature AI monitoring |
| Error Grouping | ✅ Best-in-class | ✅ Good | ⚡ Query and pipeline driven | ✅ Good |
| Session Replay | ✅ Yes | ❌ No | ✅ Available | ✅ Yes |
| Infrastructure Monitoring | ❌ Limited | ✅ Full | ✅ Through collected telemetry | ✅ Full |
| Real User Monitoring (RUM) | ✅ Yes | ⚡ Basic | ✅ Available | ✅ Advanced |
| Synthetic Monitoring | ❌ No | ❌ No | Validate current edition | ✅ Yes |
| Log Management | ⚡ Basic (breadcrumbs) | ✅ Full | ✅ Full | ✅ Full |
| Custom Dashboards | ✅ Yes | ✅ Yes | ✅ Yes | ✅ Advanced |
| Alerting | ✅ Good | ✅ Good | ✅ Query-driven | ✅ Advanced (AI-powered) |
| Data Retention | Plan-dependent | Configurable | Configurable by deployment | Plan-dependent |
| Open Source | ✅ Yes | ✅ Yes | ✅ Core (AGPL-3.0) | ❌ No |
| Self-Hosted Option | ✅ Yes | ✅ Yes | ✅ Yes | ❌ No |
| OpenTelemetry Native | ⚡ Supported | ✅ Native | ✅ Native | ✅ Supported |
| Compliance & access control | Validate plan | Deployment-dependent | Enterprise features require license validation | Validate plan and region |
| Vendor Lock-in Risk | ⚡ Medium | ✅ Low | ✅ Low for telemetry; enterprise features are commercial | ⚠️ High |
| Time to Value | ✅ Fast | ⚡ Medium | ⚡ Fast for single-node; higher for HA | ⚡ Medium (varies by scope) |
Legend:
- ✅ Full support / Excellent
- ⚡ Partial support / Good
- ❌ Not available / Limited
- ⚠️ Concern / Complex
2. Governance Framework Analysis
2.1 Data Governance & Compliance
Sentry Governance Model
graph TB
    A[Deployment Options] --> B[SaaS: Managed Service]
    A --> C[Self-Hosted: Full Control]

    B --> D[SOC 2 Type II]
    B --> E[GDPR Compliance]
    B --> F[Team Management]

    C --> G[Data Sovereignty]
    C --> H[Custom Retention]
    C --> I[Custom Compliance]

    style A fill:#e1f5fe
    style B fill:#bbdefb
    style C fill:#e8f5e8
    style D fill:#c8e6c9
    style G fill:#c8e6c9
SaaS Governance Features:
- SOC 2 Type II certified infrastructure
- GDPR and CCPA compliant data processing
- Multi-region data residency (US, EU)
- Organization and team-based access control
- Project-level isolation with granular permissions
- Automatic PII scrubbing and data redaction
- 90-day default retention (customizable by plan)
- Built-in SSO support (SAML, Google, GitHub, Okta)
- Audit logs for compliance tracking
- Business Associate Agreement (BAA) available for HIPAA
Self-Hosted Governance Features:
- Complete data sovereignty on your infrastructure
- Unlimited customizable retention policies
- Integration with enterprise authentication systems
- Custom compliance implementations (FedRAMP, PCI-DSS)
- Full control over data processing and storage locations
- Air-gapped deployment support for sensitive environments
- Custom data scrubbing rules beyond default settings
- Direct database access for audit and compliance needs
- No data leaving your network perimeter
Common Features (Both Deployments):
- Role-based access control (RBAC) with custom roles
- Advanced data scrubbing and PII protection
- Release tracking and deploy notifications
- IP allowlisting and rate limiting
- Two-factor authentication (2FA) enforcement
- API access for programmatic control
- Webhook integrations for workflow automation
- OpenTelemetry support for vendor-neutral instrumentation
Implementation Examples:
Sentry SaaS Configuration (Python)
# Sentry SaaS SDK Configuration for Compliance
import sentry_sdk
from sentry_sdk.integrations.django import DjangoIntegration

sentry_sdk.init(
    dsn="YOUR_DSN",
    before_send=custom_data_scrubber,
    send_default_pii=False,  # GDPR compliance
    environment="production",
    traces_sample_rate=0.1,  # Performance monitoring
    _experiments={
        "profiles_sample_rate": 0.1,
    },
    # SaaS-specific settings
    release="my-app@1.0.0",
    dist="12345",
)

def custom_data_scrubber(event, hint):
    # Remove sensitive data before sending to SaaS
    if 'user' in event and 'ip_address' in event['user']:
        del event['user']['ip_address']

    # Scrub sensitive environment variables
    if 'server' in event and 'env' in event['server']:
        sensitive_keys = ['API_KEY', 'SECRET_TOKEN', 'DATABASE_URL']
        for key in sensitive_keys:
            event['server']['env'].pop(key, None)

    return event
Sentry Self-Hosted Configuration (Docker Compose)
# Sentry Self-Hosted with Custom Governance
version: "3.8"

services:
  sentry:
    image: sentry:latest
    environment:
      # Data sovereignty settings
      SENTRY_SECRET_KEY: ${SENTRY_SECRET_KEY}
      SENTRY_POSTGRES_HOST: postgres
      SENTRY_REDIS_HOST: redis

      # Custom retention (self-hosted only)
      SENTRY_RETENTION_DAYS: 365 # 1 year retention

      # Security settings
      SENTRY_USE_SSL: "true"
      SENTRY_SECURE_PROXY_SSL_HEADER: "HTTP_X_FORWARDED_PROTO"

      # SAML/SSO configuration
      SENTRY_SAML_ENABLED: "true"
      SENTRY_SAML_IDP_URL: "https://your-idp.com/sso"
      SENTRY_SAML_CERT_PATH: "/etc/sentry/saml.crt"

      # Compliance settings
      SENTRY_BEACON: "false" # No telemetry to Sentry
      SENTRY_ADMIN_EMAIL: "admin@enterprise.com"

    volumes:
      - sentry-data:/var/lib/sentry/files
      - ./saml.crt:/etc/sentry/saml.crt:ro
SigNoz Governance Model
graph TB
    A[Deployment Options] --> B[Self-Hosted: Full Control]
    A --> C[Cloud: Managed Service]

    B --> D[Custom Retention]
    B --> E[Data Sovereignty]
    B --> F[Custom Compliance]

    C --> G[SOC 2 Compliance]
    C --> H[GDPR Controls]
    C --> I[RBAC & SSO]

    style A fill:#fff3e0
    style B fill:#e8f5e8
    style C fill:#e3f2fd
    style F fill:#c8e6c9
    style G fill:#c8e6c9
Self-Hosted Governance Features:
- Complete data sovereignty with on-premise deployment
- Customizable retention policies (unlimited duration possible)
- Integration with enterprise authentication (LDAP/SAML/OAuth)
- Custom compliance implementations for regulated industries
- OpenTelemetry standard compliance
- Full control over data processing and storage
- Ability to meet air-gapped and sensitive data requirements
Cloud (SaaS) Governance Features:
- SOC 2 Type II certified infrastructure
- GDPR-compliant data processing with EU region support
- Built-in RBAC with team and project-level access controls
- SSO integration (Google, GitHub, SAML)
- Automated security patches and updates
- Data encryption at rest and in transit
- Audit logging for compliance tracking
- Standard retention policies (15 days default, configurable up to 6 months)
Common Features (Both Deployments):
- OpenTelemetry-native for vendor-neutral data collection
- Data scrubbing and PII filtering capabilities
- Custom alerting and notification channels
- API access for programmatic control
- Backup and disaster recovery options
Implementation Examples:
SigNoz Self-Hosted Configuration (YAML)
# SigNoz Helm Configuration for Enterprise Self-Hosted
apiVersion: v1
kind: ConfigMap
metadata:
  name: signoz-config
data:
  config.yaml: |
    auth:
      type: "saml"
      saml:
        idp_url: "https://your-idp.com/sso"
        cert_file: "/etc/certs/saml.crt"
    retention:
      traces: "90d"  # Custom long-term retention
      metrics: "365d"
      logs: "30d"
    compliance:
      pii_scrubbing: true
      audit_logging: true
      data_classification: "restricted"
    storage:
      clickhouse:
        replication_factor: 3
        backup_enabled: true
SigNoz Cloud Configuration (API/UI)
# SigNoz Cloud Team & Access Configuration
# Configured via UI or API

organization:
  name: "Enterprise Corp"
  plan: "enterprise"

teams:
  - name: "Platform Engineering"
    role: "admin"
    members:
      - email: "platform@enterprise.com"
        role: "admin"

  - name: "Development Team"
    role: "viewer"
    members:
      - email: "dev@enterprise.com"
        role: "viewer"

sso:
  enabled: true
  provider: "saml"
  domain: "enterprise.com"

data_retention:
  traces: "30d" # Cloud: 15-180 days based on plan
  metrics: "90d"
  logs: "15d"

alerts:
  channels:
    - type: "slack"
      webhook_url: "${SLACK_WEBHOOK}"
    - type: "pagerduty"
      integration_key: "${PD_KEY}"
New Relic Governance Model
graph TB
    A[Account Hierarchy] --> B[User Groups]
    B --> C[Role Permissions]
    C --> D[Data Classification]
    D --> E[Compliance Controls]
    E --> F[Audit Trails]

    style A fill:#f3e5f5
    style F fill:#e1f5fe
Key Features:
- Hierarchical account structure
- Advanced RBAC with custom roles
- Comprehensive audit logging
- Multiple compliance certifications (SOC 2, FedRAMP, HIPAA)
- Advanced data governance tools
Implementation Example:
Terraform New Relic Governance Setup (HCL)
# Terraform New Relic Governance Setup
resource "newrelic_user_management_group" "security_team" {
  authentication_domain_id = var.auth_domain_id
  name = "Security Team"
}

resource "newrelic_user_management_access_grant" "security_access" {
  group_id = newrelic_user_management_group.security_team.id
  role_id = newrelic_user_management_role.security_admin.id
  account_ids = [var.account_id]
}

# Entity tags for compliance tracking
resource "newrelic_entity_tags" "compliance_tags" {
  guid = data.newrelic_entity.app.guid

  tag {
    key = "compliance"
    values = ["sox", "pci"]
  }

  tag {
    key = "data_classification"
    values = ["sensitive"]
  }
}
2.2 Cost Governance
Annual Cost Comparison Matrix
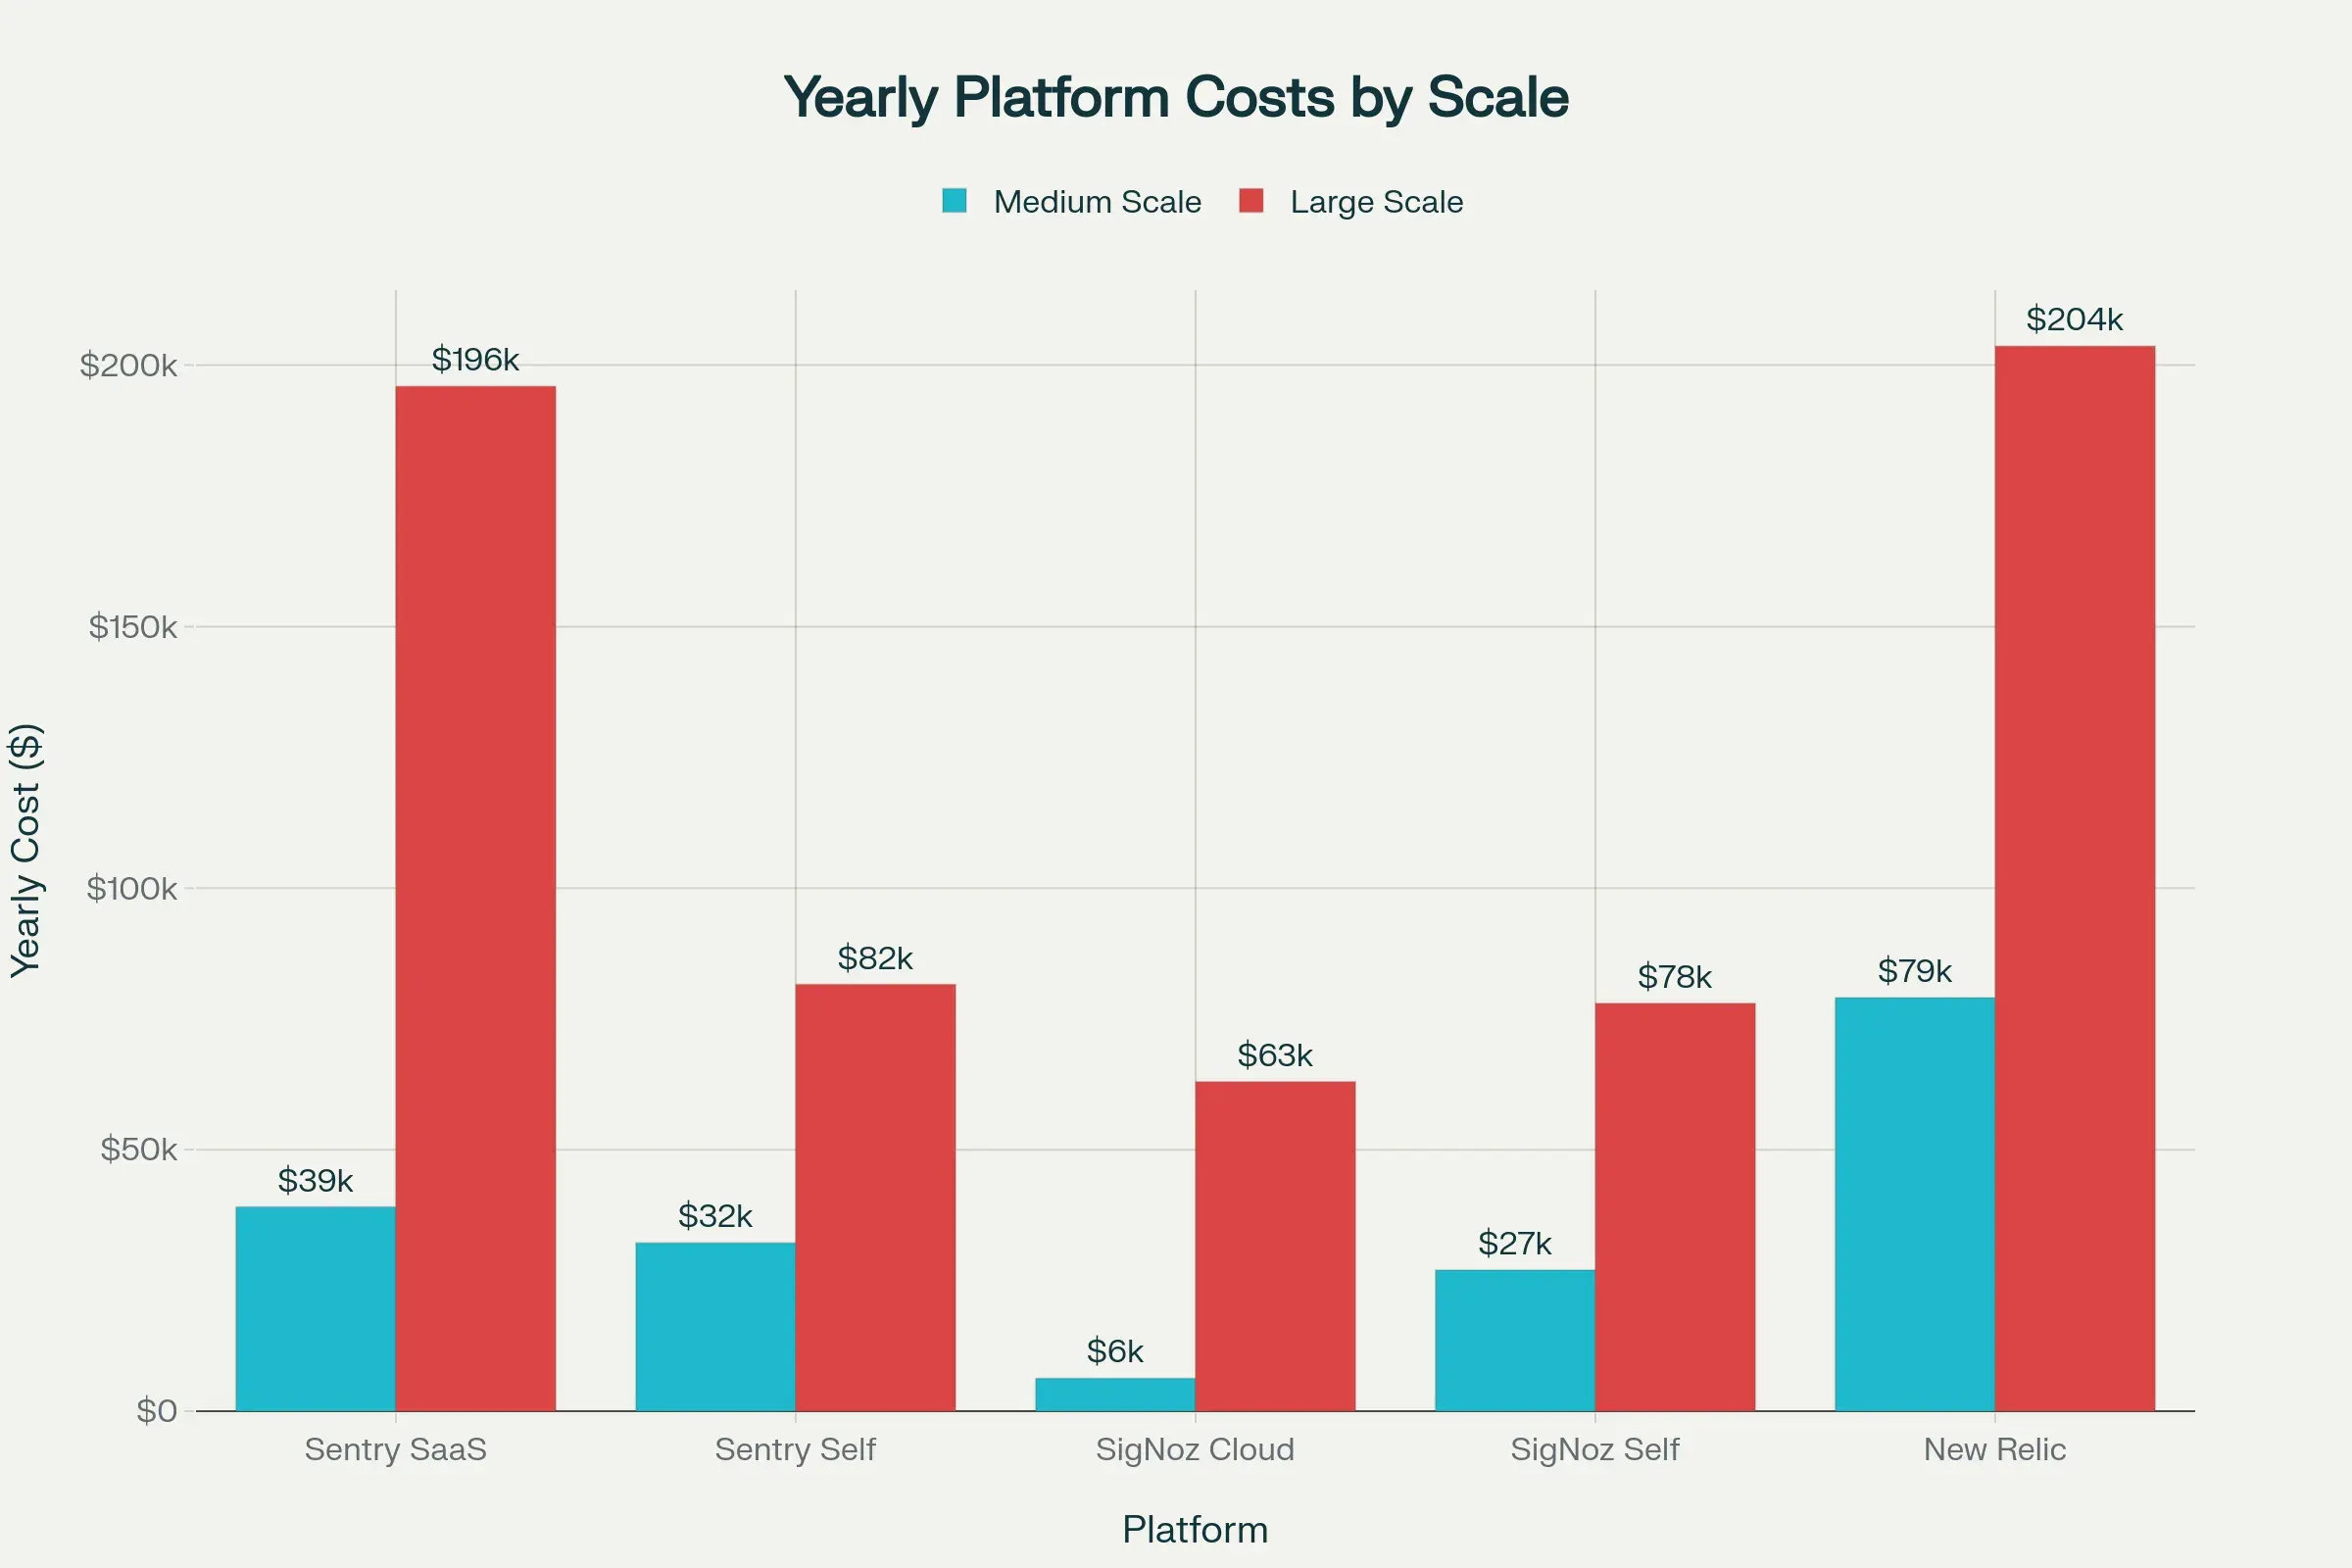
Detailed Cost Analysis:
| Deployment Model | Small Org (10-50 devs) | Medium Org (50-200 devs) | Large Org (200-1000+ devs) |
|---|---|---|---|
| Sentry SaaS | $10K-30K | $50K-100K | $150K-300K+ |
| Sentry Self-Hosted | $5K-15K (infra) | $20K-50K (infra) | $80K-150K (infra+ops) |
| SigNoz Cloud | $5K-15K | $25K-50K | $80K-200K |
| SigNoz Self-Hosted | $3K-10K (infra) | $15K-30K (infra) | $50K-100K (infra+ops) |
| New Relic SaaS | $20K-50K | $100K-200K | $300K-1M+ |
Cost Breakdown Components:
Sentry:
- Events-based pricing: $0.0002-0.001 per event
- Performance monitoring: Additional per transaction
- Session replay: Additional per session
- Self-hosted: Infrastructure + operational overhead (2-3 FTE)
SigNoz:
- Cloud: Data ingestion pricing ($0.3-0.5 per GB)
- Self-Hosted: Infrastructure (Kubernetes, ClickHouse storage, compute)
- Self-Hosted: Operational overhead (1-2 FTE for maintenance)
- Advantage: Predictable pricing with no per-user fees
New Relic:
- Data ingest pricing: $0.30-0.50 per GB (varies by commitment)
- User licensing: $99-549 per user/month (depending on tier)
- Premium features: Additional costs for synthetics, advanced security
- Volume discounts available with annual commitments
Hidden Costs to Consider:
- Integration Development: Time to integrate with existing tools
- Training: Learning curve for teams (New Relic highest, Sentry lowest)
- Migration: Cost of migrating from existing solutions
- Operational Overhead: Self-hosted requires dedicated DevOps resources
- Data Egress: Costs for moving data out (SaaS vendors)
- Support Contracts: Premium support costs (often 15-25% of license)
Cost Optimization Strategies:
- Sampling: Reduce data volume with smart sampling (especially for high-traffic apps)
- Retention Policies: Shorter retention for non-critical data
- Tiered Storage: Archive old data to cheaper storage (ClickHouse advantage for SigNoz)
- Hybrid Approach: Self-host for bulk data, SaaS for critical applications
- Right-Sizing: Start small and scale based on actual usage patterns
3. Architecture & Technical Implementation
3.1 Deployment Architecture Patterns
Sentry Enterprise Architecture
graph TB
    A[Load Balancer] --> B[Sentry Web Nodes]
    B --> C[Sentry Workers]
    C --> D[Redis Cache]
    C --> E[PostgreSQL]
    C --> F[MinIO/S3]

    G[Applications] --> H[Sentry SDKs]
    H --> A

    style A fill:#e3f2fd
    style E fill:#c8e6c9
    style F fill:#fff3e0
Key Components:
- Web Layer: Django-based application servers
- Worker Layer: Celery workers for async processing
- Storage: PostgreSQL for metadata, S3/MinIO for attachments
- Cache: Redis for session and temporary data
Self-Hosted Implementation:
Docker Compose for Sentry Enterprise (YAML)
# docker-compose.yml for Sentry Enterprise
version: "3.8"
services:
  web:
    image: sentry:latest
    environment:
      - SENTRY_SECRET_KEY=${SENTRY_SECRET_KEY}
      - SENTRY_POSTGRES_HOST=postgres
      - SENTRY_REDIS_HOST=redis
    depends_on:
      - postgres
      - redis
    ports:
      - "9000:9000"

  worker:
    image: sentry:latest
    command: run worker
    environment:
      - SENTRY_SECRET_KEY=${SENTRY_SECRET_KEY}
    depends_on:
      - postgres
      - redis

  postgres:
    image: postgres:13
    environment:
      - POSTGRES_DB=sentry
      - POSTGRES_USER=sentry
      - POSTGRES_PASSWORD=${DB_PASSWORD}
    volumes:
      - postgres_data:/var/lib/postgresql/data
SigNoz Enterprise Architecture
graph TB
    A[Load Balancer] --> B[Query Service]
    B --> C[ClickHouse Cluster]

    D[Applications] --> E[OTEL Collectors]
    E --> F[Kafka Cluster]
    F --> G[OTEL Collector Gateway]
    G --> C

    H[Frontend] --> A

    style B fill:#e8f5e8
    style C fill:#fff3e0
    style F fill:#e3f2fd
Key Components:
- Query Service: Go-based API server
- ClickHouse: Columnar database for time-series data
- OpenTelemetry Collectors: Data ingestion and processing
- Frontend: React-based dashboard
Kubernetes Deployment:
SigNoz Kubernetes Deployment (YAML)
# SigNoz Enterprise Kubernetes Deployment
apiVersion: apps/v1
kind: Deployment
metadata:
  name: signoz-query-service
spec:
  replicas: 3
  selector:
    matchLabels:
      app: signoz-query-service
  template:
    metadata:
      labels:
        app: signoz-query-service
    spec:
      containers:
        - name: query-service
          image: signoz/query-service:latest
          env:
            - name: STORAGE
              value: "clickhouse"
            - name: CLICKHOUSE_HOST
              value: "clickhouse-cluster"
            - name: CLICKHOUSE_PORT
              value: "9000"
          ports:
            - containerPort: 8080
          resources:
            requests:
              memory: "2Gi"
              cpu: "1000m"
            limits:
              memory: "4Gi"
              cpu: "2000m"
New Relic Enterprise Integration
graph TB
    A[Applications] --> B[New Relic Agents]
    B --> C[New Relic Platform]
    C --> D[Data Processing]
    D --> E[AI/ML Engine]
    D --> F[Alerting System]
    D --> G[Dashboard Engine]

    H[Infrastructure] --> I[Infrastructure Agent]
    I --> C

    style C fill:#f3e5f5
    style E fill:#e1f5fe
    style F fill:#ffebee
Key Components:
- Agents: Language-specific monitoring agents
- Platform: Managed SaaS infrastructure
- AI/ML: Proactive insights and anomaly detection
- APIs: Comprehensive REST and GraphQL APIs
Terraform Infrastructure as Code:
New Relic Enterprise Setup (Terraform/HCL)
# New Relic Enterprise Setup
resource "newrelic_alert_policy" "high_priority" {
  name = "High Priority Alerts"
  incident_preference = "PER_POLICY"
}

resource "newrelic_nrql_alert_condition" "high_error_rate" {
  policy_id   = newrelic_alert_policy.high_priority.id
  name        = "High Error Rate"
  type        = "static"
  description = "Alert when error rate exceeds threshold"

  nrql {
    query             = "SELECT percentage(count(*), WHERE error IS true) FROM Transaction"
    evaluation_offset = 3
  }

  critical {
    operator              = "above"
    threshold             = 5.0
    threshold_duration    = 300
    threshold_occurrences = "ALL"
  }

  warning {
    operator              = "above"
    threshold             = 3.0
    threshold_duration    = 600
    threshold_occurrences = "ALL"
  }
}

# Workload configuration for service grouping
resource "newrelic_workload" "microservices_cluster" {
  name       = "Microservices Cluster"
  account_id = var.account_id

  entity_search_query {
    query = "tags.environment='production' AND tags.cluster='main'"
  }

  scope_account_ids = [var.account_id]
}
3.2 Data Flow & Processing
Feature Coverage Comparison Matrix
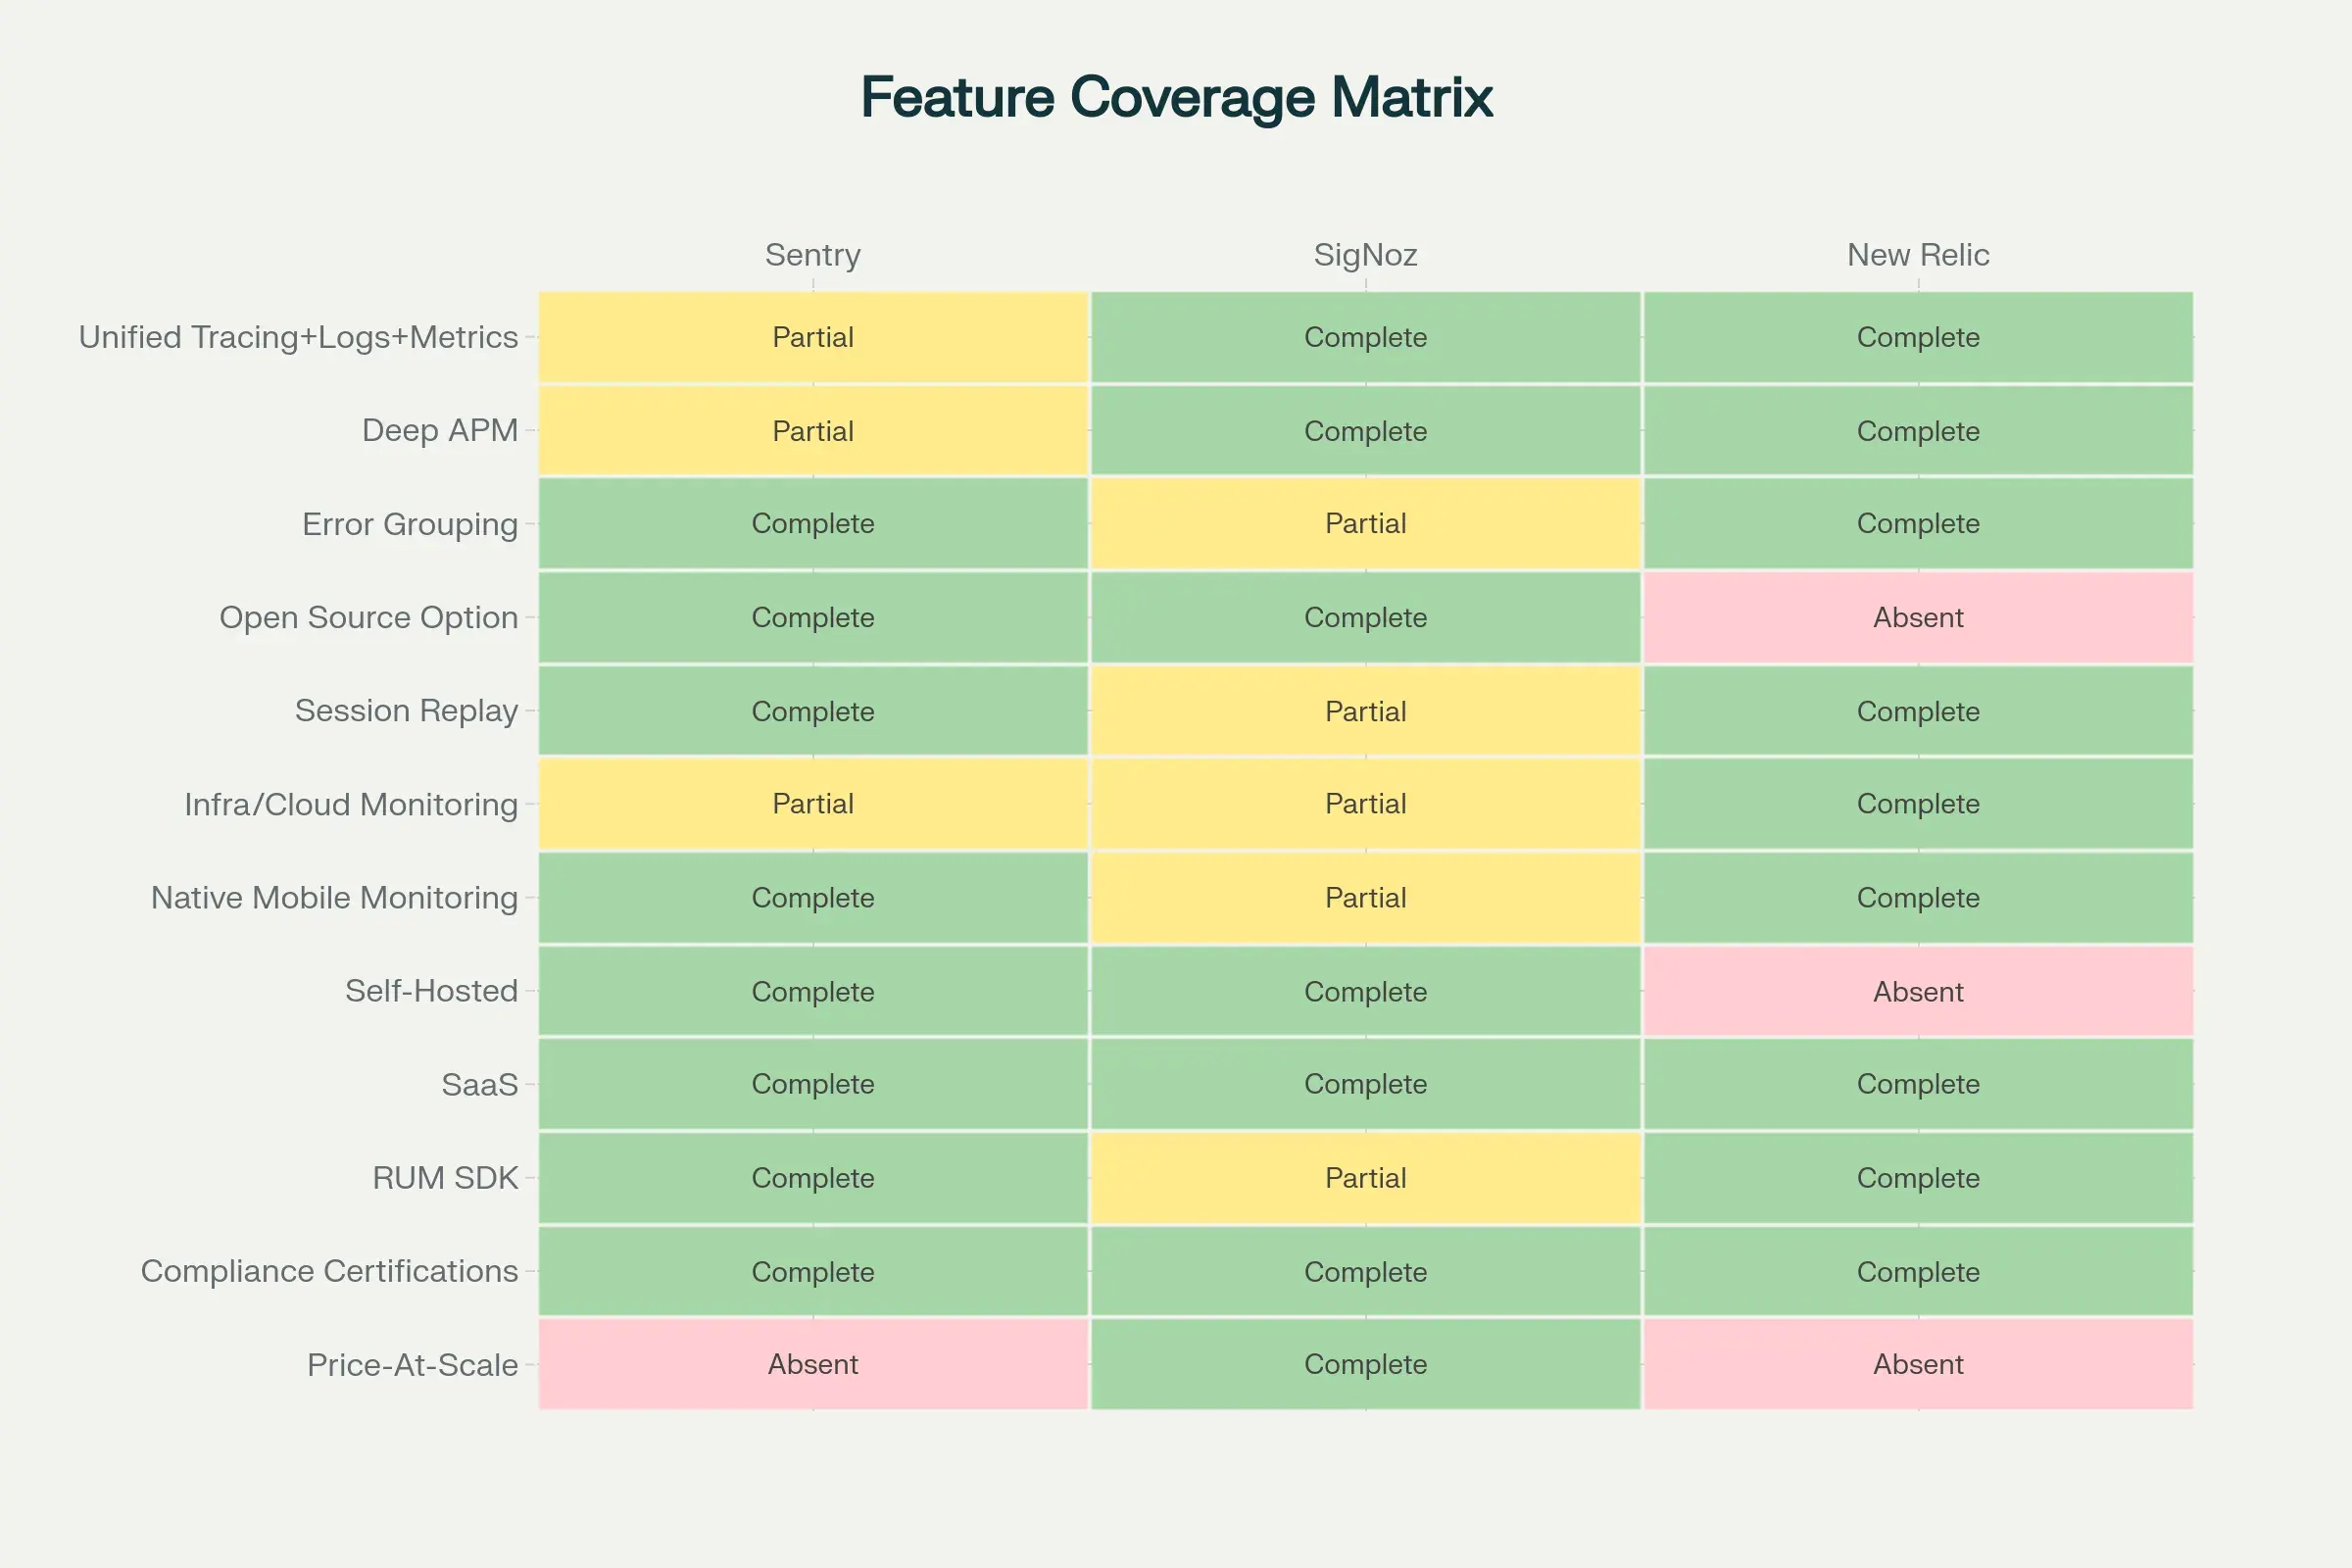
The heatmap predates the OpenObserve update. The tables below contain the current four-platform comparison; the image should not be read as an OpenObserve scorecard.
Data Processing Capabilities:
| Feature | Sentry | SigNoz | OpenObserve | New Relic |
|---|---|---|---|---|
| Traces | ⚡ Limited (errors) | ✅ Full distributed tracing | ✅ Full distributed tracing | ✅ Full distributed tracing |
| Metrics | ⚡ Basic (performance) | ✅ Full (Prometheus compatible) | ✅ Full (OTLP and PromQL support) | ✅ Full (dimensional) |
| Logs | ⚡ Limited (breadcrumbs) | ✅ Full log management | ✅ Full log management | ✅ Full log management |
| AI/LLM observability | ⚡ Via integrations | ⚡ Evaluate current fit | ✅ LLM and agent traces, usage, cost, and evaluations | ✅ Mature AI monitoring |
| Real User Monitoring | ✅ Yes | ⚡ Basic | ✅ Available | ✅ Full (advanced) |
| Infrastructure Monitoring | ❌ No | ✅ Yes (full) | ✅ Via collected telemetry | ✅ Yes (comprehensive) |
| Custom Dashboards | ✅ Yes | ✅ Yes | ✅ Yes | ✅ Yes (advanced) |
| Alerting | ✅ Good | ✅ Good | ✅ Query-driven | ✅ Advanced (AI-powered) |
| API Access | ✅ REST API | ✅ REST API | ✅ REST API | ✅ REST + GraphQL (NerdGraph) |
| Query Language | Custom filters | ClickHouse SQL | SQL-style; PromQL for metrics | NRQL (proprietary) |
| Data Sampling | ✅ Configurable | ✅ Configurable | ✅ Configurable in pipelines and collection | ✅ Configurable |
| Cardinality Handling | ⚡ Limited | ✅ Excellent (ClickHouse) | ✅ Validate against workload and object-store design | ✅ Good |
Observability Pillars Coverage:
| Platform | Metrics | Traces | Logs | Unified Experience |
|---|---|---|---|---|
| Sentry | ⚡ 60% | ⚡ 40% | ⚡ 30% | ⚡ 50% |
| SigNoz | ✅ 95% | ✅ 95% | ✅ 90% | ✅ 95% |
| OpenObserve | ✅ Full | ✅ Full | ✅ Full | ✅ Full |
| New Relic | ✅ 100% | ✅ 95% | ✅ 95% | ✅ 98% |
4. Security Architecture & Implementation
4.1 Security Framework Comparison
Sentry Security Implementation
Advanced Sentry Security Configuration (Python)
# Advanced Sentry Security Configuration
import sentry_sdk
from sentry_sdk.integrations.sqlalchemy import SqlalchemyIntegration

# Custom security event processor
def security_processor(event, hint):
    # Remove sensitive headers
    if 'request' in event:
        if 'headers' in event['request']:
            sensitive_headers = ['authorization', 'x-api-key', 'cookie']
            for header in sensitive_headers:
                event['request']['headers'].pop(header, None)

    # Mask PII in user context
    if 'user' in event:
        if 'email' in event['user']:
            event['user']['email'] = mask_email(event['user']['email'])

    return event

sentry_sdk.init(
    dsn="YOUR_DSN",
    before_send=security_processor,
    integrations=[
        SqlalchemyIntegration(),
    ],
    # Security settings
    send_default_pii=False,
    attach_stacktrace=True,
    auto_session_tracking=False,  # Disable for sensitive apps
    max_breadcrumbs=50,
    max_value_length=1024,
    before_breadcrumb=security_breadcrumb_filter,
)
SigNoz Security Configuration
SigNoz Security Helm Values (YAML)
# SigNoz Security Helm Values
global:
  security:
    enabled: true

# Authentication configuration
auth:
  type: "oauth"
  oauth:
    provider: "azure"
    client_id: "${AZURE_CLIENT_ID}"
    client_secret: "${AZURE_CLIENT_SECRET}"
    tenant_id: "${AZURE_TENANT_ID}"

# TLS configuration
tls:
  enabled: true
  cert_manager:
    enabled: true
    issuer: "letsencrypt-prod"

# Network policies
networkPolicy:
  enabled: true
  ingress:
    - from:
        - namespaceSelector:
            matchLabels:
              name: monitoring
      ports:
        - protocol: TCP
          port: 8080

# Data encryption
encryption:
  at_rest: true
  in_transit: true
  key_management: "azure-keyvault"
New Relic Security Controls
New Relic Security Configuration (Terraform/HCL)
# New Relic Security Configuration
resource "newrelic_synthetics_secure_credential" "api_key" {
  key         = "API_SECRET_KEY"
  value       = var.sensitive_api_key
  description = "Production API key for external service"
}

# Security monitoring alert
resource "newrelic_nrql_alert_condition" "security_violation" {
  policy_id = newrelic_alert_policy.security.id
  name      = "Security Violation Detected"
  type      = "static"

  nrql {
    query = <<EOF
SELECT count(*)
FROM Transaction
WHERE httpResponseCode IN (401, 403, 404)
AND userAgentName NOT LIKE '%monitor%'
EOF
  }

  critical {
    operator              = "above"
    threshold             = 10
    threshold_duration    = 300
    threshold_occurrences = "ALL"
  }
}

# Data retention policy for compliance
resource "newrelic_data_partition_rule" "pii_data" {
  name                = "pii_logs"
  enabled             = true
  nrql                = "SELECT * FROM Log WHERE message LIKE '%PII%'"
  retention_policy    = "SECONDARY"
  description         = "Partition for logs containing PII data"
}
4.2 Compliance & Certification Matrix
| Compliance Standard | Sentry | SigNoz | New Relic |
|---|---|---|---|
| SOC 2 Type II | ✅ | ⚡ Self-Hosted | ✅ |
| GDPR | ✅ | ✅ | ✅ |
| HIPAA | ⚡ BAA Available | ⚡ Self-Hosted | ✅ |
| FedRAMP | ❌ | ⚡ Self-Hosted | ✅ Moderate |
| ISO 27001 | ✅ | ⚡ Self-Hosted | ✅ |
| PCI DSS | ⚡ Documentation | ⚡ Self-Hosted | ✅ |
5. Operational Excellence & Performance
5.1 Platform Capabilities Radar Analysis
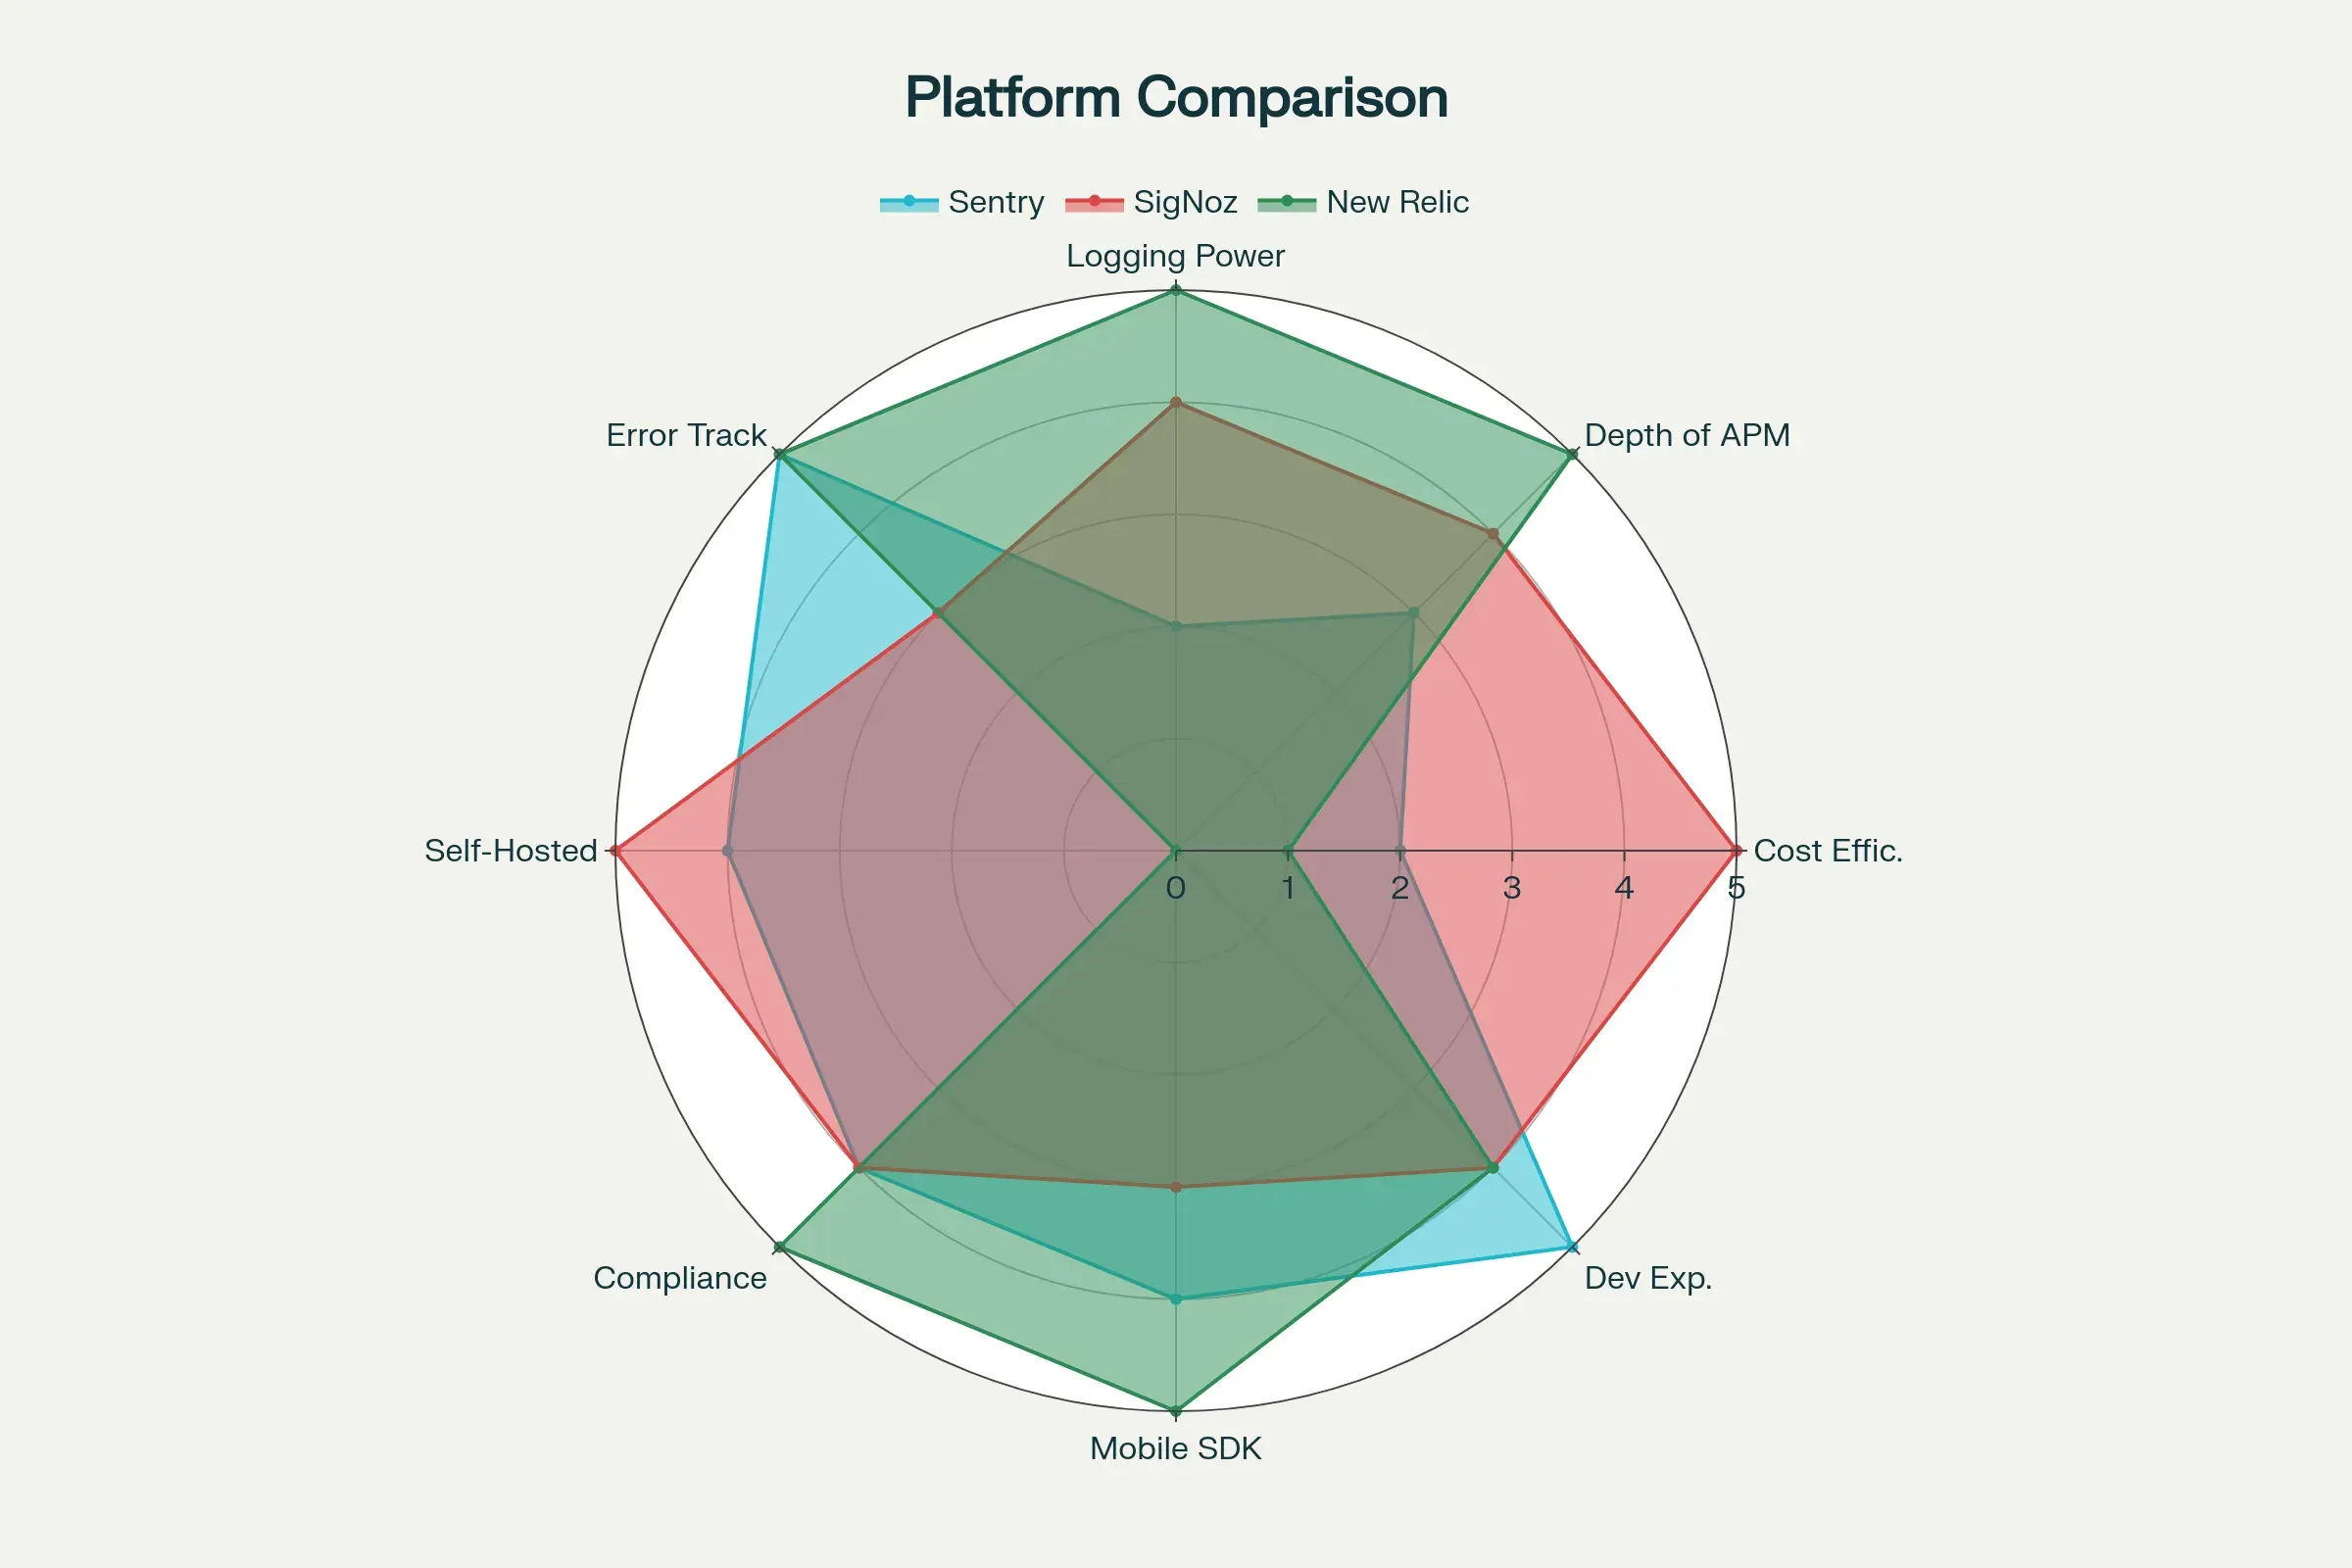
Performance Metrics Analysis:
5.2 Scalability & Performance Benchmarks
Data Ingestion Capacity
| Platform | Events/Second | Max Throughput | Retention | Storage Efficiency |
|---|---|---|---|---|
| Sentry SaaS | 100K+ | 8.6B+ daily | 90 days default | High (optimized for errors) |
| Sentry Self | 50K+ | 4.3B+ daily | Configurable | High (PostgreSQL + blob storage) |
| SigNoz Cloud | 500K+ | 40B+ daily | 15 days (up to 6m) | Very High (ClickHouse columnar) |
| SigNoz Self | 1M+ | 86B+ daily | Unlimited config | Excellent (ClickHouse native) |
| New Relic | 10M+ | 850B+ daily | 8 days-13 months | High (managed proprietary) |
Query Performance Comparison
| Operation | Sentry | SigNoz (ClickHouse) | New Relic |
|---|---|---|---|
| Simple Error Query | < 100ms | < 50ms | < 200ms |
| Complex Trace Query | N/A | < 500ms | < 1s |
| Log Search (1M logs) | N/A | < 2s | < 3s |
| Dashboard Load | < 1s | < 2s | < 2s |
| Aggregation (1B spans) | N/A | < 5s | < 10s |
| Full-Text Search | < 500ms | < 1s | < 2s |
Scalability Characteristics
Sentry:
- Horizontal scaling via web nodes and workers
- PostgreSQL can become bottleneck at extreme scale
- Redis for distributed caching
- Blob storage (S3/MinIO) for attachments and debug files
- Recommended: < 10M events/day per cluster
SigNoz:
- Excellent horizontal scalability via ClickHouse sharding
- Kafka for buffering and high-throughput ingestion
- OpenTelemetry collectors scale independently
- Can handle 100M+ spans/day per cluster
- ClickHouse compression: 10-100x better than row-based DBs
New Relic:
- Fully managed auto-scaling (no infrastructure concerns)
- Global distribution with edge ingestion
- Can handle billions of events per day effortlessly
- Built-in redundancy and disaster recovery
- Multi-region data residency options
Resource Requirements (Self-Hosted)
| Component | Sentry (Medium) | SigNoz (Medium) |
|---|---|---|
| Web/API Servers | 4x 4 vCPU, 8GB RAM | 3x 4 vCPU, 8GB RAM |
| Workers | 6x 4 vCPU, 8GB RAM | N/A |
| Database | PostgreSQL: 8vCPU | ClickHouse: 16vCPU |
| Database RAM | 32GB | 64GB (benefits from more) |
| Cache (Redis) | 16GB | N/A |
| Message Queue | N/A | Kafka: 8vCPU, 32GB |
| Storage | 1-5TB SSD | 2-10TB SSD (compressed) |
| Total vCPUs | ~40 vCPU | ~30 vCPU |
| Total RAM | ~100GB | ~100GB |
SigNoz ClickHouse Query Example (SQL)
-- SigNoz ClickHouse Query Example
SELECT
    serviceName,
    operationName,
    quantile(0.95)(durationNano) as p95_latency,
    count() as request_count
FROM signoz_traces.distributed_signoz_index_v2
WHERE timestamp >= now() - INTERVAL 1 HOUR
AND hasError = 1
GROUP BY serviceName, operationName
ORDER BY p95_latency DESC
LIMIT 100;
5.3 Monitoring & Alerting Strategies
Sentry Alert Configuration
Sentry Advanced Alerting (Python)
# Sentry Advanced Alerting
from sentry_sdk import configure_scope, add_breadcrumb

def custom_alert_processor(event):
    # Custom business logic alerting
    if event.get('level') == 'error':
        error_type = event.get('exception', {}).get('type')
        if error_type in ['DatabaseConnectionError', 'PaymentProcessingError']:
            # Escalate critical business errors
            event['tags']['alert_level'] = 'critical'
            event['tags']['escalation'] = 'immediate'

    return event

# Performance monitoring with custom metrics
def track_business_metrics():
    with configure_scope() as scope:
        scope.set_tag("operation", "checkout_process")
        scope.set_extra("cart_value", get_cart_value())

        # Custom transaction for business process monitoring
        with sentry_sdk.start_transaction(op="business", name="checkout_flow"):
            process_payment()
SigNoz Custom Dashboards
SigNoz Dashboard Configuration (YAML)
# SigNoz Dashboard Configuration
dashboard:
  name: "Enterprise Service Health"
  panels:
    - title: "Service Response Time P95"
      type: "time_series"
      query: |
        SELECT
          timestamp,
          serviceName,
          quantile(0.95)(duration) as p95_duration
        FROM traces
        WHERE timestamp >= now() - INTERVAL 1 HOUR
        GROUP BY timestamp, serviceName
        ORDER BY timestamp

    - title: "Error Rate by Service"
      type: "stat"
      query: |
        SELECT
          serviceName,
          countIf(statusCode >= 400) * 100.0 / count() as error_rate
        FROM traces
        WHERE timestamp >= now() - INTERVAL 1 HOUR
        GROUP BY serviceName
New Relic Advanced Monitoring
New Relic Custom Dashboard (Terraform/HCL)
# New Relic Custom Dashboard
resource "newrelic_one_dashboard" "enterprise_overview" {
  name = "Enterprise Service Overview"

  page {
    name = "Service Health"

    widget_line {
      title  = "Throughput by Service"
      row    = 1
      column = 1
      width  = 6
      height = 3

      nrql_query {
        account_id = var.account_id
        query      = "SELECT rate(count(*), 1 minute) FROM Transaction FACET appName TIMESERIES"
      }
    }

    widget_billboard {
      title  = "Error Rate"
      row    = 1
      column = 7
      width  = 6
      height = 3

      nrql_query {
        account_id = var.account_id
        query      = "SELECT percentage(count(*), WHERE error IS true) FROM Transaction"
      }

      critical = 5
      warning  = 2
    }
  }
}

# Advanced NRQL alert for business metrics
resource "newrelic_nrql_alert_condition" "business_kpi" {
  policy_id = newrelic_alert_policy.business_critical.id
  name      = "Revenue Impact Alert"
  type      = "static"

  nrql {
    query = <<EOF
SELECT sum(numeric(revenue))
FROM Transaction
WHERE appName = 'ecommerce-api'
AND transactionName = 'checkout_complete'
COMPARE WITH 1 hour ago
EOF
  }

  critical {
    operator              = "below"
    threshold             = -20  # 20% decrease
    threshold_duration    = 600
    threshold_occurrences = "ALL"
  }
}
6. Implementation Roadmap & Recommendations
6.1 Enterprise Decision Matrix
Platform Selection Criteria
| Criteria | Weight | Sentry (SaaS) | Sentry (Self) | SigNoz (Cloud) | SigNoz (Self) | New Relic |
|---|---|---|---|---|---|---|
| Total Cost of Ownership | 25% | 6/10 | 7/10 | 8/10 | 9/10 | 5/10 |
| Feature Completeness | 20% | 7/10 | 7/10 | 8/10 | 8/10 | 10/10 |
| Compliance & Security | 20% | 8/10 | 9/10 | 8/10 | 9/10 | 10/10 |
| Scalability | 15% | 7/10 | 6/10 | 8/10 | 9/10 | 10/10 |
| Vendor Independence | 10% | 6/10 | 9/10 | 7/10 | 10/10 | 3/10 |
| Community & Support | 10% | 9/10 | 8/10 | 7/10 | 7/10 | 9/10 |
| Weighted Score | 100% | 7.1/10 | 7.6/10 | 7.9/10 | 8.7/10 | 7.9/10 |
Scoring Rationale:
Cost of Ownership:
- SigNoz Self-Hosted wins with lowest total cost at scale
- New Relic most expensive but includes managed services
- Sentry middle ground with events-based pricing
Feature Completeness:
- New Relic most comprehensive (synthetics, advanced AI/ML, mobile)
- SigNoz strong unified observability but missing some advanced features
- Sentry focused on errors/performance, missing infrastructure monitoring
Compliance & Security:
- New Relic and self-hosted options lead with full control
- SaaS options still strong with SOC2, GDPR compliance
- Self-hosted provides maximum data sovereignty
Scalability:
- New Relic and SigNoz Self-Hosted excel at massive scale
- Sentry Self-Hosted can face PostgreSQL bottlenecks
- All can handle enterprise workloads with proper architecture
Vendor Independence:
- SigNoz Self-Hosted and Sentry Self-Hosted win as open source
- OpenTelemetry support reduces lock-in for SigNoz
- New Relic has highest lock-in risk with proprietary agents
6.2 Implementation Strategies
Phased Migration Approach
gantt
    title Enterprise Observability Migration Timeline
    dateFormat YYYY-MM-DD
    section Phase 1: Foundation
    Infrastructure Setup    :p1, 2026-01-01, 30d
    Security Configuration  :p2, after p1, 20d
    Basic Monitoring       :p3, after p2, 15d

    section Phase 2: Integration
    Application Instrumentation :p4, after p3, 45d
    Custom Dashboards      :p5, after p4, 30d
    Alerting Configuration :p6, after p5, 20d

    section Phase 3: Optimization
    Performance Tuning     :p7, after p6, 30d
    Advanced Features      :p8, after p7, 25d
    Documentation & Training :p9, after p8, 20d
6.3 Risk Mitigation Strategies
Multi-Platform Approach
Hybrid Observability Implementation (Python)
# Hybrid observability implementation
class ObservabilityManager:
    def __init__(self):
        self.sentry_client = sentry_sdk
        self.signoz_tracer = get_tracer("signoz")
        self.newrelic_agent = newrelic.agent

    def track_error(self, error, context=None):
        """Multi-platform error tracking"""
        # Primary error tracking with Sentry
        with sentry_sdk.push_scope() as scope:
            if context:
                for key, value in context.items():
                    scope.set_extra(key, value)
            sentry_sdk.capture_exception(error)

        # Trace correlation with SigNoz
        with self.signoz_tracer.start_as_current_span("error_handling") as span:
            span.set_attribute("error.type", type(error).__name__)
            span.set_attribute("error.message", str(error))
            span.record_exception(error)

        # Business metrics with New Relic
        self.newrelic_agent.record_custom_metric(
            "Errors/BusinessImpact",
            1,
            {"error_type": type(error).__name__}
        )
7. Conclusion & Strategic Recommendations
7.1 Executive Recommendations
For Large Enterprises
Scenario A: Maximum Features & Minimal Operational Overhead
- Primary: New Relic for comprehensive enterprise features and managed services
- Secondary: SigNoz Self-Hosted for cost optimization on non-critical workloads
- Specialized: Sentry for critical application error monitoring and debugging
- Budget: $300K-600K+ annually
- Team: Managed service focus, minimal DevOps for observability
Scenario B: Cost-Conscious with Strong DevOps
- Primary: SigNoz Self-Hosted for unified observability at scale
- Secondary: Sentry SaaS for critical error tracking and developer experience
- Backup: New Relic for specific high-value applications
- Budget: $100K-200K annually
- Team: Strong Kubernetes/DevOps expertise required
For Medium Enterprises
Scenario A: Balanced Approach (Recommended)
- Primary: SigNoz Cloud for unified observability with managed infrastructure
- Complement: Sentry SaaS for superior error tracking and session replay
- Budget: $50K-150K annually
- Team: Small DevOps team, focus on application development
- Migration Path: Can move to self-hosted SigNoz as team grows
Scenario B: Maximum Value
- Primary: SigNoz Self-Hosted for comprehensive observability
- Complement: Sentry Self-Hosted for error tracking
- Budget: $30K-80K annually (infrastructure + 1-2 FTE operational)
- Team: Dedicated DevOps/Platform team
- Advantage: Complete data sovereignty and predictable costs
Scenario C: Rapid Deployment
- Primary: New Relic with standard tier
- Budget: $100K-250K annually
- Team: Small team needing quick results
- Trade-off: Higher cost for reduced operational complexity
For Startups & Small Teams
Scenario A: Lean and Agile (Recommended)
- Primary: Sentry SaaS for application monitoring (generous free tier)
- Metrics/Logs: SigNoz Cloud (starts free, scales with growth)
- Budget: $5K-30K annually
- Team: Small engineering team, minimal DevOps
- Growth Path: Clear upgrade path as revenue grows
Scenario B: Open Source First
- Primary: Sentry Self-Hosted (open source)
- Infrastructure: SigNoz Self-Hosted
- Budget: $3K-15K annually (cloud infrastructure only)
- Team: Technical founders with DevOps skills
- Advantage: Maximum learning and zero vendor lock-in
Scenario C: Quick MVP
- Primary: New Relic free tier (100GB/month)
- Secondary: Sentry free tier
- Budget: $0-10K annually
- Team: Focus entirely on product development
- Limitation: Will need to migrate as scale increases
7.2 Success Metrics & KPIs
Technical Metrics
- Mean Time to Detection (MTTD): < 5 minutes
- Mean Time to Resolution (MTTR): < 30 minutes
- System Availability: > 99.9%
- Performance Baseline: < 200ms P95 response time
Business Metrics
- Observability ROI: Cost savings from faster incident resolution
- Developer Productivity: Reduced debugging time
- Customer Satisfaction: Improved application reliability
- Compliance Adherence: 100% audit success rate
7.3 Future Considerations
Emerging Trends
- OpenTelemetry Adoption: All platforms moving toward OTel standards
- AI/ML Integration: Predictive analytics and automated insights
- Edge Observability: Monitoring for edge computing and IoT
- Cost Optimization: FinOps integration for observability spending
Technology Evolution
- Serverless Monitoring: Enhanced support for FaaS platforms
- Container Orchestration: Deep Kubernetes integration
- Multi-Cloud Strategy: Unified monitoring across cloud providers
- Security Integration: DevSecOps and observability convergence
This comprehensive analysis provides the foundation for informed decision-making in enterprise observability platform selection. The recommendations balance technical capabilities, cost considerations, and strategic business objectives to ensure optimal outcomes for organizations of all sizes.